Social Feed Analytics Dashboard
We’ve added a comprehensive reporting dashboard so you can see how your attendees are engaging and manage your event’s social content more effectively.
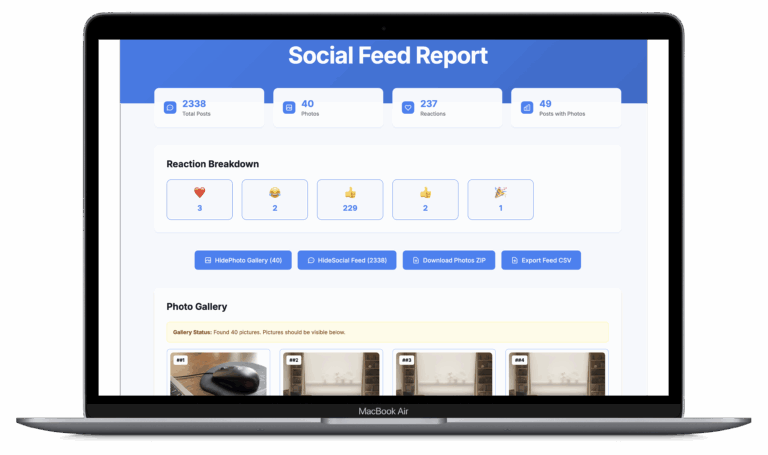
What you’ll find in the new Social Feed Report:
Real engagement insights. Get a clear picture of your event’s social activity with metrics that actually matter – total posts, photo shares, reaction counts, and engagement patterns. You can finally see which content resonates most with your attendees.
Reaction breakdown by emoji. See exactly how people are responding to content. Are they loving the keynote updates? Laughing at the networking icebreakers? The emoji breakdown gives you a quick pulse on sentiment and engagement style.
Live photo wall capabilities. Download all shared photos as a ZIP file in real-time to feed into digital displays and photo walls throughout your venue. No more hunting through individual posts – just grab the latest batch and showcase attendee moments as they happen.
Easy data export. Export the entire social feed as a CSV for post-event analysis, sponsor summaries, or deeper engagement insights.
Visual content gallery. Browse through all the photos attendees have shared in a clean, organized view. Perfect for quick moderation or selecting highlights for your photo wall displays.
Why this matters:
You’ve been asking for better visibility into how attendees engage with each other during events. This dashboard gives you concrete data to understand what works, plus practical tools to manage and showcase the experience in real-time.
The live photo export is especially useful for creating dynamic photo walls during your event – attendees love seeing their pictures displayed around the venue, and it encourages even more social sharing.
Implementation:
The Social Feed Report is now available in your event management dashboard. Access it from your admin panel during or after any event. All the data updates automatically from your attendees’ activity, so your photo walls stay current throughout the conference.
This sets us up to add more detailed analytics in future updates based on what metrics prove most valuable for your events.